決定木やサポートベクトルマシンの予測平面は『決定木の予測平面を描画してみる①』『サポートベクトルマシンの予測平面を描画してみる』ここらで見ましたが、他のアルゴリズムでは予測平面の形がどんなんになるんかーなー、ということで今回はそれを見ていきたいと思います。
データを用意
みんな大好きメイクブロブズで、データを作ってもらいます。
import numpy as np
import matplotlib.pyplot as plt
from matplotlib.colors import ListedColormap
plt.style.use("ggplot")
from sklearn.datasets import make_blobs

x,y=make_blobs(n_samples=500,n_features=2,centers=3,random_state=0)
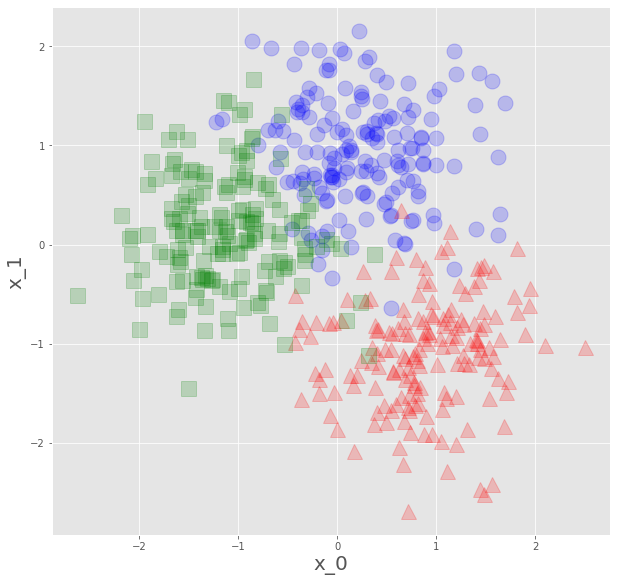
特徴量2個の、3クラスのデータです。
def plot_datasets(x,y):
    plt.plot(x[:,0][y==0],x[:,1][y==0],"o",c="blue",ms=15,alpha=0.2)
    plt.plot(x[:,0][y==1],x[:,1][y==1],"^",c="red",ms=15,alpha=0.2)
    plt.plot(x[:,0][y==2],x[:,1][y==2],"s",c="green",ms=15,alpha=0.2)
    plt.xlabel("x_0",fontsize=20)
    plt.ylabel("x_1",fontsize=20)

def plot_decision_boundary(clf,x,m=0.2):
    _x0=np.linspace(x[:,0].min()-m,x[:,0].max()+m,500)
    _x1=np.linspace(x[:,1].min()-m,x[:,1].max()+m,500)
    x0,x1=np.meshgrid(_x0,_x1)
    x_new=np.c_[x0.ravel(),x1.ravel()]
    y_pred=clf.predict(x_new).reshape(x1.shape)
    cmap=ListedColormap(["mediumblue","indianred","greenyellow"])
    plt.contourf(x0,x1,y_pred,alpha=0.3,cmap=cmap)

from sklearn.preprocessing import StandardScaler
scaler=StandardScaler()

scaler.fit(x)
x_s=scaler.transform(x)
描画関数を定義、距離を計算するアルゴリズムもあるので、標準化してプロット。
fig=plt.figure(figsize=(10,10))

ax1=fig.add_subplot(111)
ax1.set_aspect('equal')
plot_datasets(x_s,y)

plt.show()
こんなんをいただいたので、これを学習データとして、各アルゴリズムで予測平面を見ていきます。
サポートベクトルマシン
まずはこう。
from sklearn.svm import SVCそして学習。
svm1=SVC(C=5,gamma=0.5)
svm2=SVC(C=10,gamma=1)
svm3=SVC(C=15,gamma=1.5)

svm1.fit(x_s,y)
svm2.fit(x_s,y)
svm3.fit(x_s,y)
で、描画します。
plt.figure(figsize=(30,10))

plt.subplot(131).set_aspect('equal')
plot_decision_boundary(svm1,x_s)
plot_datasets(x_s,y)
plt.title(f"SVM C=5,gamma=0.5,score={svm1.score(x_s,y)}",fontsize=20)

plt.subplot(132).set_aspect('equal')
plot_decision_boundary(svm2,x_s)
plot_datasets(x_s,y)
plt.title(f"SVM C=10,gamma=1,score={svm2.score(x_s,y)}",fontsize=20)

plt.subplot(133).set_aspect('equal')
plot_decision_boundary(svm3,x_s)
plot_datasets(x_s,y)
plt.title(f"SVM C=15,gamma=1.5,score={svm3.score(x_s,y)}",fontsize=20)

plt.show()
こんな感じ、相変わらず滑らかなのが気持ちいい。
・距離最大化パワー
・誤分類許すまじパワー
・データ1個1個の存在主張パワー
の三つ巴で予測平面が変わる訳ですが、左下の青領域はなんだ?
k近傍法
クラスを予測したいデータの、近くにあるデータの多数決で、そのクラスを予測する、という
シンプルでわかりやすくておちゃめなアルゴリズム。
from sklearn.neighbors import KNeighborsClassifier

knc1=KNeighborsClassifier(n_neighbors=3)
knc2=KNeighborsClassifier(n_neighbors=7)
knc3=KNeighborsClassifier(n_neighbors=11)

knc1.fit(x_s,y)
knc2.fit(x_s,y)
knc3.fit(x_s,y)
各々、近くの3個、7個、11個のデータの多数決で予測する、というモデルを構築。
plt.figure(figsize=(30,10))

plt.subplot(131).set_aspect('equal')
plot_decision_boundary(knc1,x_s)
plot_datasets(x_s,y)
plt.title(f"knc k=3,score={knc1.score(x_s,y)}",fontsize=20)

plt.subplot(132).set_aspect('equal')
plot_decision_boundary(knc2,x_s)
plot_datasets(x_s,y)
plt.title(f"knc k=7,score={knc2.score(x_s,y)}",fontsize=20)

plt.subplot(133).set_aspect('equal')
plot_decision_boundary(knc3,x_s)
plot_datasets(x_s,y)
plt.title(f"knc k=11,score={knc3.score(x_s,y)}",fontsize=20)

plt.show()
近くの何個のデータで多数決します?ってのがハイパーパラメータで、
少ないと過学習よりになるわけですね。境界線が独特です。
決定木(CART)
これでも見ておきましょう。
from sklearn.tree import DecisionTreeClassifier

tree1=DecisionTreeClassifier(max_depth=3,min_samples_leaf=15)
tree2=DecisionTreeClassifier(max_depth=5,min_samples_leaf=10)
tree3=DecisionTreeClassifier(max_depth=7,min_samples_leaf=5)

tree1.fit(x_s,y)
tree2.fit(x_s,y)
tree3.fit(x_s,y)
こんな感じで、さあどうぞ。
plt.figure(figsize=(30,10))

plt.subplot(131).set_aspect('equal')
plot_decision_boundary(tree1,x_s)
plot_datasets(x_s,y)
plt.title(f"tree max_depth=3,min_samples_leaf=10,score={tree1.score(x_s,y)}",fontsize=20)

plt.subplot(132).set_aspect('equal')
plot_decision_boundary(tree2,x_s)
plot_datasets(x_s,y)
plt.title(f"tree max_depth=5,min_samples_leaf=5,score={tree2.score(x_s,y)}",fontsize=20)

plt.subplot(133).set_aspect('equal')
plot_decision_boundary(tree3,x_s)
plot_datasets(x_s,y)
plt.title(f"tree max_depth=7,min_samples_leaf=3,score={tree3.score(x_s,y)}",fontsize=20)

plt.show()
見慣れたやつですよね。先のやつと並べてみます。


予測平面の形が各々こうなってくるのですが、なんか、人の性格の違いのようですね。
俺はこう分ける、いや、俺はこう、みたいな。決定木は、めっちゃ真面目な子な感じします。
ロジスティック回帰とk平均法
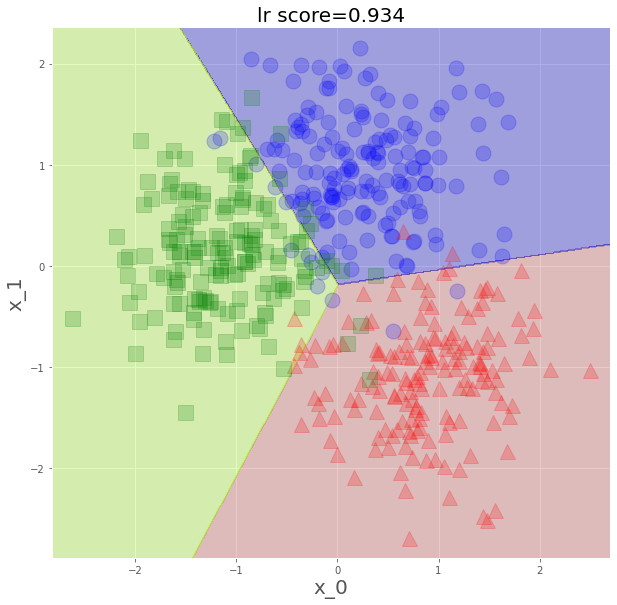
まだ、きちんと学べていないのですが、ロジスティック回帰でもやってみます。
特徴量の線形結合を確率に接続するやつですね、回帰という名がついていますが確率を出して
クラスを予測するので分類用のアルゴリズムです。
2値ならロジット関数に接続して…というのを以前学習したのですが、
数式わかりませんが、多値も対応してくれているようで、やってみます。
from sklearn.linear_model import LogisticRegression

lr=LogisticRegression()
lr.fit(x_s,y)
色々パラメータあるようですが、ひとまずシンプルにこれで。
fig=plt.figure(figsize=(10,10))

ax1=fig.add_subplot(111)
ax1.set_aspect('equal')

plot_decision_boundary(lr,x_s)
plot_datasets(x_s,y)
plt.title(f"lr score={lr.score(x_s,y)}",fontsize=20)

plt.show()
まさに、線形結合での分類って感じですね。
最後、k平均法でもやってみます。
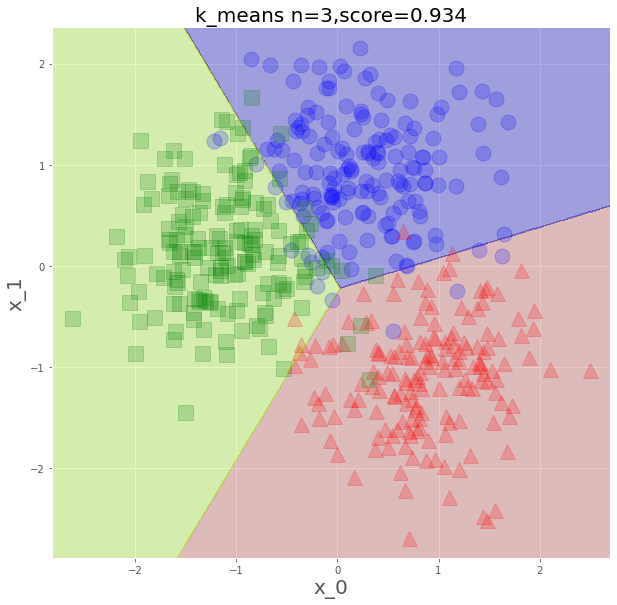
まず、適当に点を取ってそこからの距離でデータをクラス分け、各クラスの重心を計算、今度この重心から近いデータで再度クラス分け…を繰り返し、重心動かなくなるまでやるよ、って言うやつですね。
重心とデータの距離の2乗の総和を最小にしていくわけです。
分けるクラスの数がハイパーパラメータになるのですが、エルボー(肘)法という妥当であろうクラス数見つける手法があります。最初の点の取り方で、どこの極値に行くかが分かれるのですが、
この辺もいい感じに処理してくれているようです。
from sklearn.cluster import KMeans
k_means=KMeans(n_clusters=3).fit(x_s)
クラスの数は3つなので、これを指定して学習。
教師なしの手法なので、 k_means.labels_ ここに入る予測クラスと真のクラスを比較して
正解率を出します。
from sklearn.metrics import accuracy_score

score=accuracy_score(y_true=y,y_pred=k_means.labels_)
score

0.934
描画すると、
fig=plt.figure(figsize=(10,10))

ax1=fig.add_subplot(111)
ax1.set_aspect('equal')

plot_decision_boundary(k_means,x_s)
plot_datasets(x_s,y)
plt.title(f"k_means n=3,score={score}",fontsize=20)

plt.show()
重心との距離の近さで分類するので、こういう平面になるわけですね。
手法はまだまだ星のようにありますが、今日はこの辺で。


