前回の記事で、『Scikit-learn乳がん診断データセットで深層ニューラルネットワークしてみる』
これをやりました。中々の正解率がでましたので、他でもやってみようということで、
今回は回帰ですが、やっていこうと思います。
データの確認とか準備とか
import numpy as np
import pandas as pd

import matplotlib.pyplot as plt
plt.style.use("ggplot")

from keras import models
from keras import layers
from keras.callbacks import EarlyStopping
from sklearn.model_selection import train_test_split

from sklearn.datasets import fetch_california_housing
前回とほぼ同じですが、データセットが違います。
ordata=fetch_california_housing()

df=pd.DataFrame(ordata.data,columns=ordata.feature_names)
df.head()
こないして、データをみてやります。
| MedInc | HouseAge | AveRooms | AveBedrms | Population | AveOccup | Latitude | Longitude | |
| 0 | 8.3252 | 41 | 6.984127 | 1.02381 | 322 | 2.555556 | 37.88 | -122.23 |
| 1 | 8.3014 | 21 | 6.238137 | 0.97188 | 2401 | 2.109842 | 37.86 | -122.22 |
| 2 | 7.2574 | 52 | 8.288136 | 1.073446 | 496 | 2.80226 | 37.85 | -122.24 |
| 3 | 5.6431 | 52 | 5.817352 | 1.073059 | 558 | 2.547945 | 37.85 | -122.25 |
| 4 | 3.8462 | 52 | 6.281853 | 1.081081 | 565 | 2.181467 | 37.85 | -122.25 |
| MedInc | 区画の収入の中央値 |
| HouseAge | 区画内の住宅の平均築年数 |
| AveRooms | 区画内の住宅の平均部屋数 |
| AveBedrms | 区画内の住宅の平均ベッドルーム数 |
| Population | 区画の人口 |
| AveOccup | 区画の平均住宅占有率 |
| Latitude | 区画の緯度 |
| Longitude | 区画の経度 |
1行1区画(ブロック)で、上記各々のデータが入っています。目的変数(target)には、区画ごとの
住宅価格の中央値が入っています。8つの特徴量で、住宅価格を回帰しましょう、という問題です。
目的変数を別途DFにして、
df_MedHouseVal=pd.DataFrame(ordata.target,columns=["MedHouseVal"])くっつける
df_=pd.concat([df_MedHouseVal,df],axis=1)
df_.head()| MedHouseVal | MedInc | HouseAge | AveRooms | AveBedrms | Population | AveOccup | Latitude | Longitude | |
| 0 | 4.526 | 8.3252 | 41 | 6.984127 | 1.02381 | 322 | 2.555556 | 37.88 | -122.23 |
| 1 | 3.585 | 8.3014 | 21 | 6.238137 | 0.97188 | 2401 | 2.109842 | 37.86 | -122.22 |
| 2 | 3.521 | 7.2574 | 52 | 8.288136 | 1.073446 | 496 | 2.80226 | 37.85 | -122.24 |
| 3 | 3.413 | 5.6431 | 52 | 5.817352 | 1.073059 | 558 | 2.547945 | 37.85 | -122.25 |
| 4 | 3.422 | 3.8462 | 52 | 6.281853 | 1.081081 | 565 | 2.181467 | 37.85 | -122.25 |
この状態でinfoを見てやります。
df_.info()

<class 'pandas.core.frame.DataFrame'>
RangeIndex: 20640 entries, 0 to 20639
Data columns (total 9 columns):
 #   Column       Non-Null Count  Dtype
---  ------       --------------  -----
 0   MedHouseVal  20640 non-null  float64
 1   MedInc       20640 non-null  float64
 2   HouseAge     20640 non-null  float64
 3   AveRooms     20640 non-null  float64
 4   AveBedrms    20640 non-null  float64
 5   Population   20640 non-null  float64
 6   AveOccup     20640 non-null  float64
 7   Latitude     20640 non-null  float64
 8   Longitude    20640 non-null  float64
dtypes: float64(9)
memory usage: 1.4 MB
ということで、20640区画のデータが欠損値なしでそろっていることが分かります。
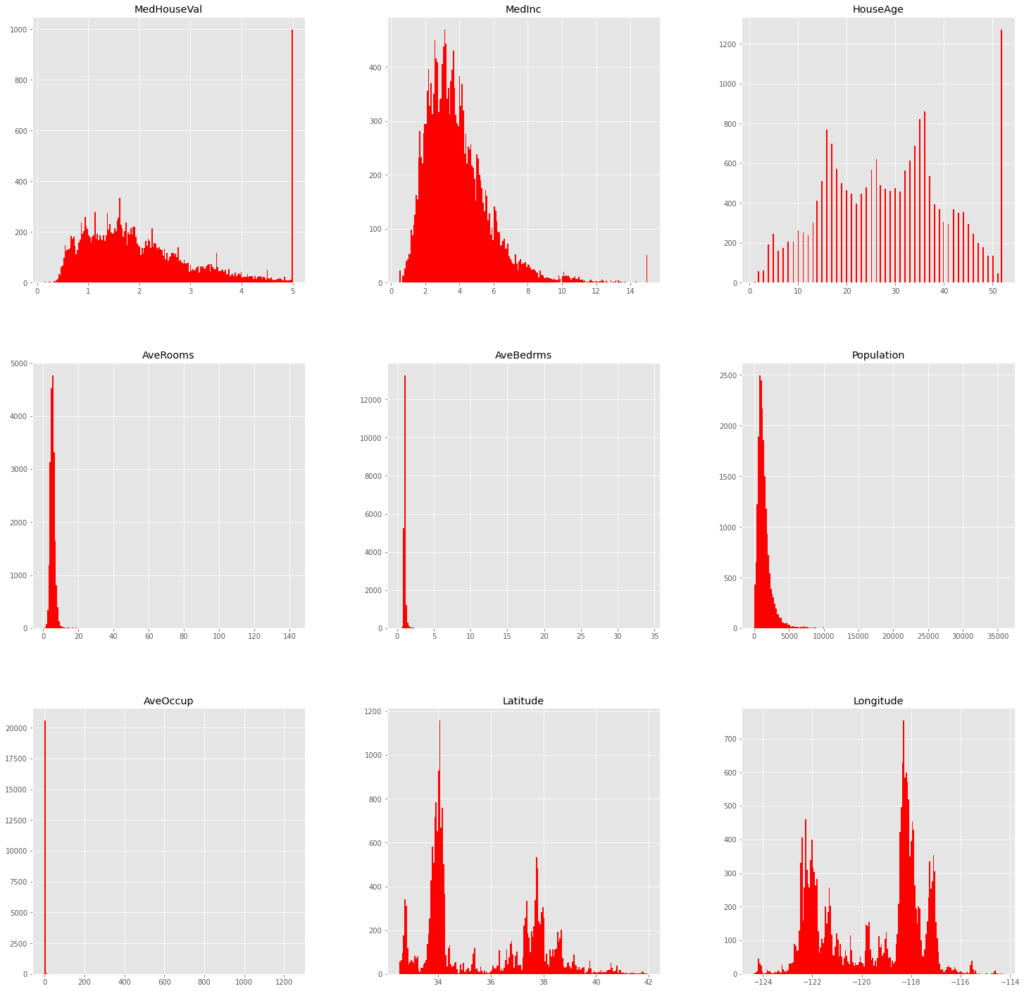
データの数が多いので、各々の分布を見てやります。
df_.hist(bins=200,figsize=(25,25),color="red")
MedHouseValとMedIncとHouseAgeに外れ値があるようなので、これを除去します。
df_.describe()| MedHouseVal | MedInc | HouseAge | AveRooms | AveBedrms | Population | AveOccup | Latitude | Longitude | |
| count | 20640 | 20640 | 20640 | 20640 | 20640 | 20640 | 20640 | 20640 | 20640 |
| mean | 2.068558 | 3.870671 | 28.63949 | 5.429 | 1.096675 | 1425.477 | 3.070655 | 35.63186 | -119.57 |
| std | 1.153956 | 1.899822 | 12.58556 | 2.474173 | 0.473911 | 1132.462 | 10.38605 | 2.135952 | 2.003532 |
| min | 0.14999 | 0.4999 | 1 | 0.846154 | 0.333333 | 3 | 0.692308 | 32.54 | -124.35 |
| 25% | 1.196 | 2.5634 | 18 | 4.440716 | 1.006079 | 787 | 2.429741 | 33.93 | -121.8 |
| 50% | 1.797 | 3.5348 | 29 | 5.229129 | 1.04878 | 1166 | 2.818116 | 34.26 | -118.49 |
| 75% | 2.64725 | 4.74325 | 37 | 6.052381 | 1.099526 | 1725 | 3.282261 | 37.71 | -118.01 |
| max | 5.00001 | 15.0001 | 52 | 141.9091 | 34.06667 | 35682 | 1243.333 | 41.95 | -114.31 |
分布図とdescribeから、各々最大値のところで外れ値となっているっぽいので、
df_= df_[df_["MedHouseVal"] < df_["MedHouseVal"].max()]
df_= df_[df_["MedInc"] < df_["MedInc"].max()]
df_= df_[df_["HouseAge"] < df_["HouseAge"].max()]
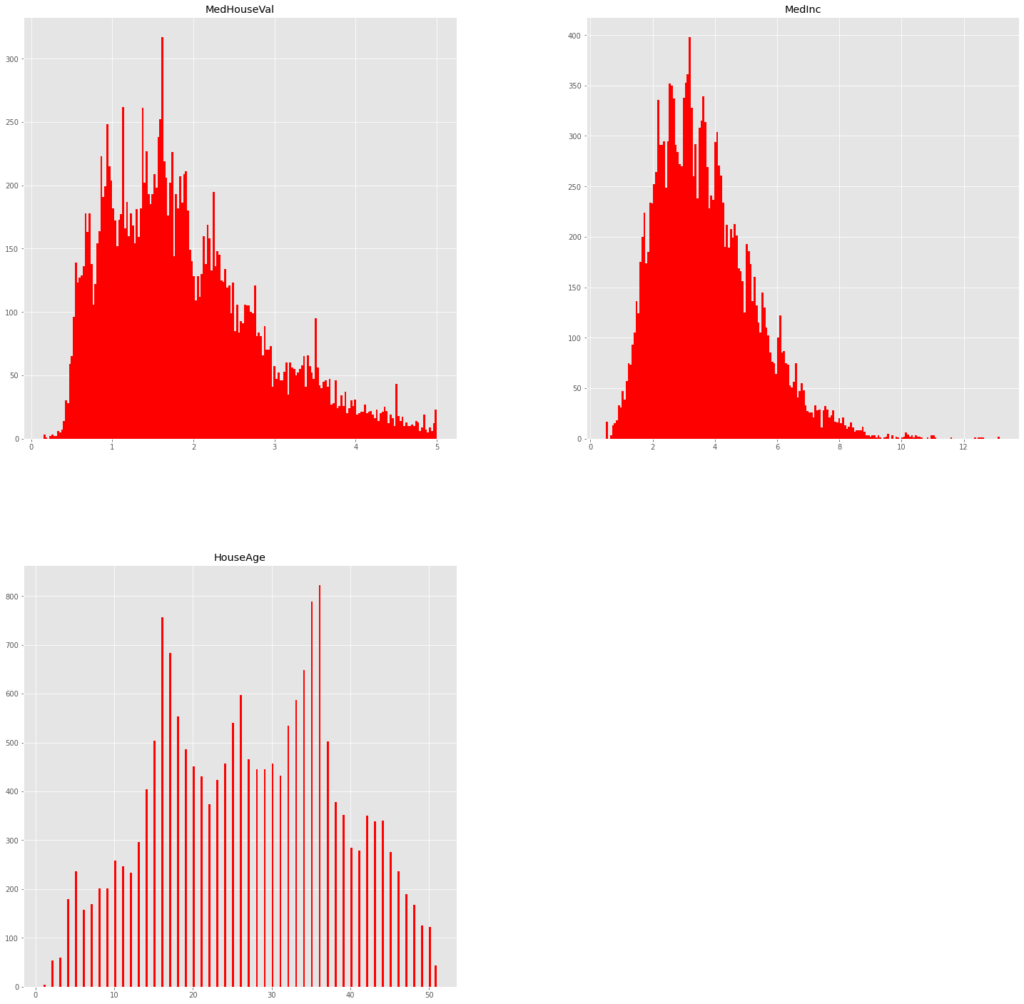
こうして除きます。もっかい見てやると、
df_[["MedHouseVal","MedInc","HouseAge"]].hist(bins=200,figsize=(25,25),color="red")
外れ値が消えてくれました。infoを再度見ておくと、
df_.info()

<class 'pandas.core.frame.DataFrame'>
Int64Index: 18570 entries, 0 to 20639
Data columns (total 9 columns):
 #   Column       Non-Null Count  Dtype
---  ------       --------------  -----
 0   MedHouseVal  18570 non-null  float64
 1   MedInc       18570 non-null  float64
 2   HouseAge     18570 non-null  float64
 3   AveRooms     18570 non-null  float64
 4   AveBedrms    18570 non-null  float64
 5   Population   18570 non-null  float64
 6   AveOccup     18570 non-null  float64
 7   Latitude     18570 non-null  float64
 8   Longitude    18570 non-null  float64
dtypes: float64(9)
memory usage: 1.4 MB
ご覧の通り、データが18570個に減りました。例のごとく、このデータを標準化して、学習用やら検証用やらテスト用やらにやっていきます。
x_df=df_.iloc[:,1:].reset_index(drop="True")
y_df=df_.iloc[:,:1].reset_index(drop="True")

x_=x_df.values
y=y_df.values

from sklearn.preprocessing import StandardScaler
scaler=StandardScaler()
x=scaler.fit_transform(x_)

x_train,x_test,y_train,y_test=train_test_split(x,y,test_size=0.3,random_state=0)
x_train,x_train_val,y_train,y_train_val=train_test_split(x_train,y_train,test_size=0.3,random_state=0)
print(x_train.shape,x_train_val.shape,x_test.shape)
print(y_train.shape,y_train_val.shape,y_test.shape)

(9099, 8) (3900, 8) (5571, 8)
(9099, 1) (3900, 1) (5571, 1)
やりました。
モデルの構築と学習
さて、モデル構築ですが、前回は2値分類だったので、出力層の活性化関数をシグモイドに指定していましたが、今回は回帰なので、リニアに指定します。
model=models.Sequential()
model.add(layers.Dense(500,activation="relu",input_dim=8))
model.add(layers.Dense(250,activation="relu"))
model.add(layers.Dense(100,activation="relu"))
model.add(layers.Dense(50,activation="relu"))
model.add(layers.Dense(1,activation="linear"))
こんな感じにしてみました。
model.summary()

Model: "sequential_2"
_________________________________________________________________
 Layer (type)                Output Shape              Param #
=================================================================
 dense_10 (Dense)            (None, 500)               4500

 dense_11 (Dense)            (None, 250)               125250

 dense_12 (Dense)            (None, 100)               25100

 dense_13 (Dense)            (None, 50)                5050

 dense_14 (Dense)            (None, 1)                 51
                                                     =================================================================
Total params: 159,951
Trainable params: 159,951
Non-trainable params: 0
____________________________________________________________
約16万個のパラメータですって。
前回同様、他もろもろ指定して、学習!
model.compile(optimizer="adam",
              loss="mean_squared_error",
              metrics=["mean_squared_error"])

callbacks=[EarlyStopping(monitor="val_mean_squared_error",patience=5)]

model_results=model.fit(x_train,
                  y_train,
                  epochs=100,
                  batch_size=500,
                  verbose=1,
                  callbacks=callbacks,
                  validation_data=(x_train_val,y_train_val))
で、回帰なので決定係数を見マース。
from sklearn import metrics

print(f"train_r2_score:{metrics.r2_score(y_train,model.predict(x_train))}")
print(f"val_r2_score:{metrics.r2_score(y_train_val,model.predict(x_train_val))}")
print(f"test_r2_score:{metrics.r2_score(y_test,model.predict(x_test))}")

train_r2_score:0.7893249139012292
val_r2_score:0.7225655524573514
test_r2_score:0.750738987864861
決定係数で、テストデータに対してこれですから、かなり優秀な部類と思います。
ちなみに、ランダムフォレストでもサクっとやってみると、
from sklearn.ensemble import RandomForestRegressor

rtree=RandomForestRegressor(n_estimators=500,min_samples_leaf=10,random_state=0).fit(x_train,y_train.ravel())

print(f"train_r2_score:{metrics.r2_score(y_train,rtree.predict(x_train))}")
print(f"val_r2_score:{metrics.r2_score(y_train_val,rtree.predict(x_train_val))}")
print(f"test_r2_score:{metrics.r2_score(y_test,rtree.predict(x_test))}")

train_r2_score:0.8410055117828509
val_r2_score:0.7226441833988966
test_r2_score:0.7456163453839174
過学習ぎみですが、この子も優秀!


